O&O Defrag offers various options for receiving further information about defragmentation. The tabs in the lower section of the "Start" ribbon will help you switch between the categories explained below.
Time View
The Time View illustrates recent actions you have run. For each drive there’ll be a brief summary displaying the results of any corresponding action.
History
Thanks to clearly displayed statistics, you can tell what effect a regular defragmentation is having on your system and you can track the success over weeks and months. You can monitor how many files have been sped up and how many excessive file fragments have been put together, for example. Based on the, you can then adjust your settings to match the defragmentation to your computer habits in order to get the best results.
Drive status
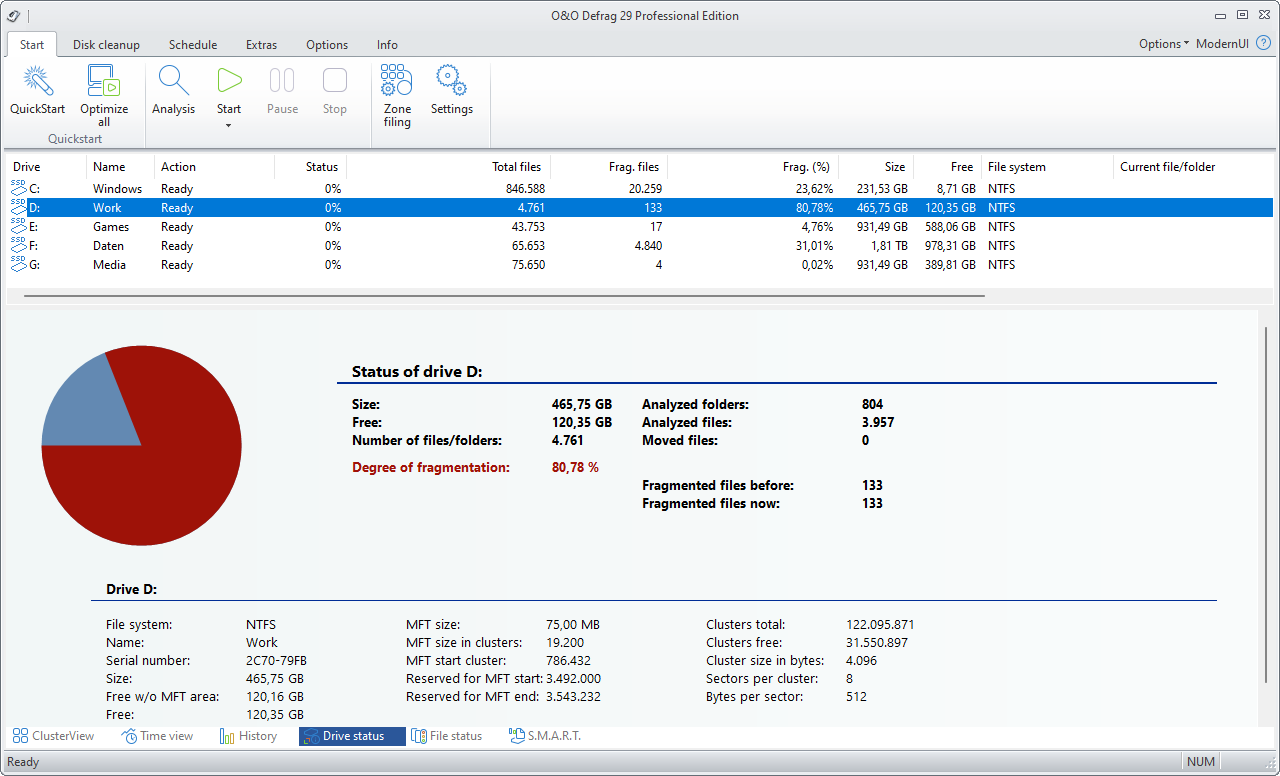
Displays information about the conditions of selected drives before and after defragmentation.
Here you can find information about your drive, the amount of space being used on it, and the file system. The refreshed pie chart will dynamically represent the proportional level of fragmentation during a defragmentation run.
The Status for the entire drive informs you about both the analyzed as well as the non-analyzed files and folders. A new evaluation occurs dynamically with each defragmentation.

O&O Defrag: Drive status
File status
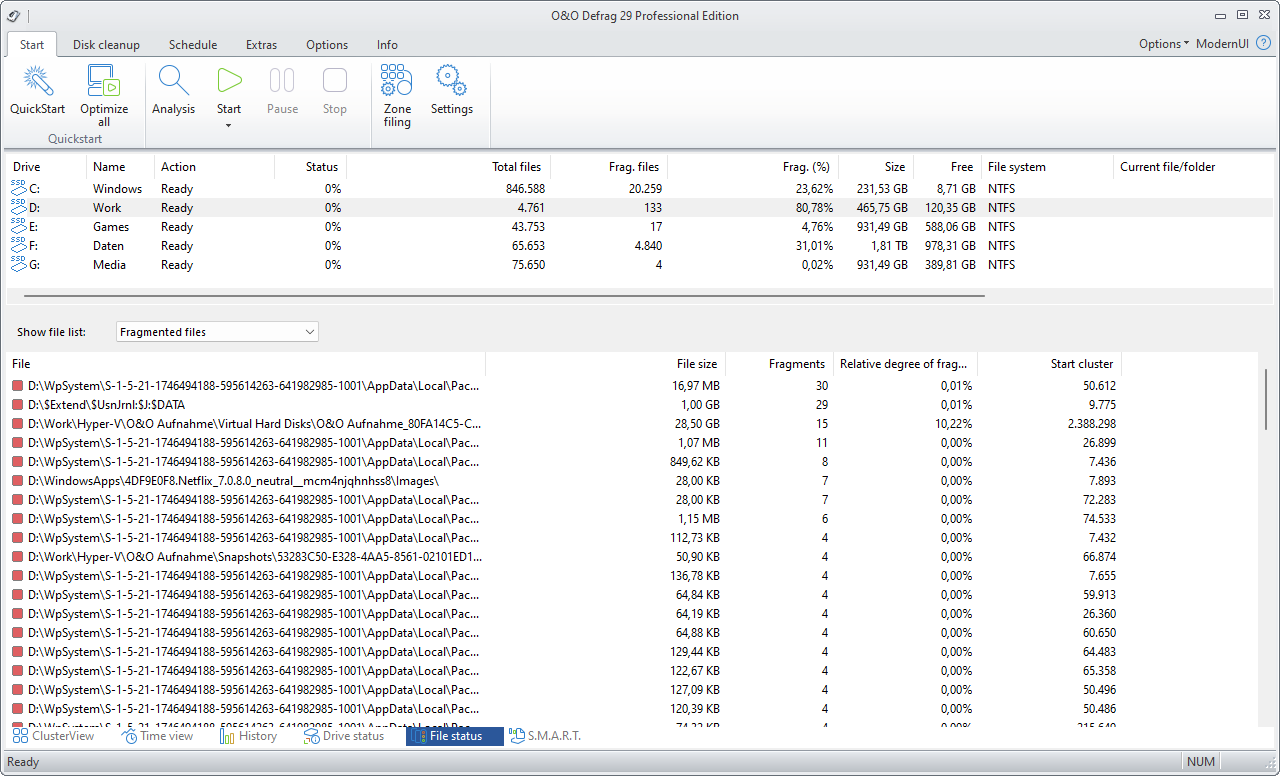
File Status provides an overview of the largest and most heavily fragmented files on your drive. The contents of this file system statistic can also be found in the status reports. You have to first analyze the file statistics of a drive in order to have them displayed here. This will occur after you click Analysis in the Ribbon bar.
Files can be listed according to various criteria with the Sorting drop-down menu.

O&O Defrag: File status
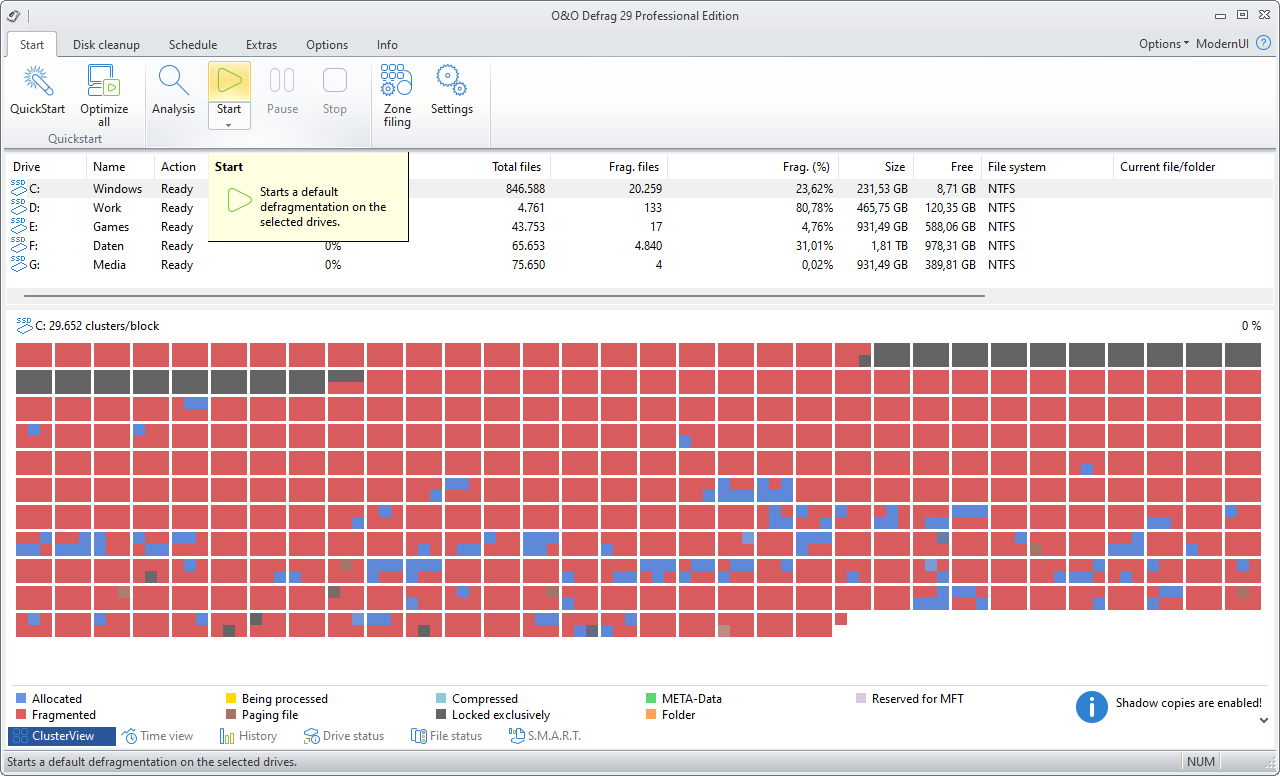
O&O Defrag allows you to defragment individual drives or entire computers with just a few mouse clicks.

Start defragmentation
The first defragmentation usually requires the most time because O&O Defrag has to check your entire system and move all files into their optimal position. This is especially the case with systems that have been in use for a long time and have rarely or never been defragmented.
The COMPLETE methods in particular are very time-consuming because the entire file structure needs to be optimized, which involves moving even files that are not fragmented.
We therefore recommend an initial defragmentation with the STEALTH or SPACE methods. These methods consolidate your hard disks very quickly and efficiently. Afterwards, you can use the COMPLETE methods for optimum performance or stick to the quicker STEALTH and SPACE methods. Whichever method you choose, your system will be significantly quicker than it was before!
S.M.A.R.T.
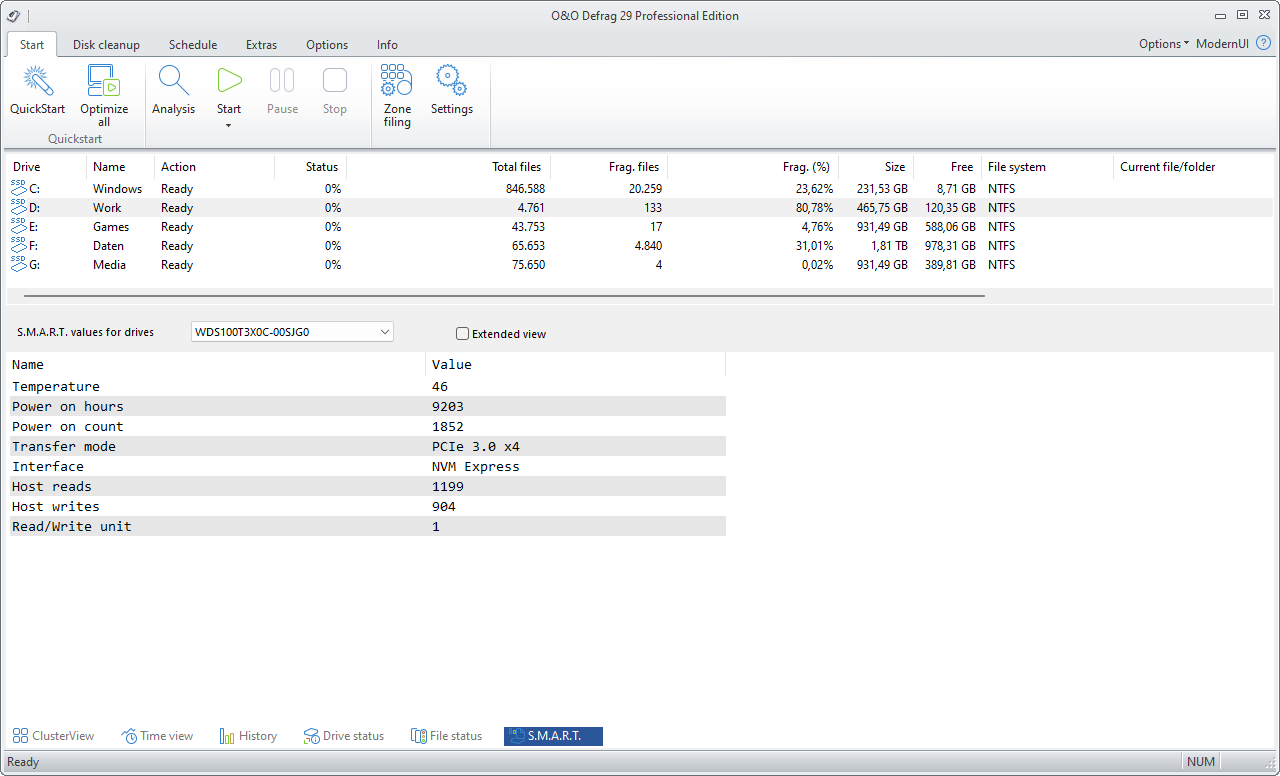
O&O Defrag uses the S.M.A.R.T. (Self-Monitoring, Analysis and Reporting Technology) integrated in hard disks to permanently monitor the status of drives. This allows the program to readout the values for essential properties that are detected by the hard disk during a self-diagnosis. Some of these values might be the total number of hours in operation or the read error rate. A detailed readout keeps you informed about the most important data on your hard disk: everything from the number of previous system starts up to the current temperature. In this way, O&O Defrag warns you about impending problems.
Each value in the expanded view is sorted on a value scale (raw value) from 0 to 100, 200 or 255.
| For SSDs / Name | Description |
|---|---|
| Temperature | Temperature of your drive in ° C. With normal use, temperatures between 40°C and 65°C are possible. The lower the raw value, the better. |
| Operating hours | Indicates in hours how long the SSD has been in operation (including standby). Indicates wear and tear, but says nothing about usage conditions during this time. The lower the raw value, the better. |
| Switch-on processes | The number of times your drive has been turned on and off. The lower the raw value, the better. |
| Transmission mode | Indicates how the SSD is connected (interface). |
| Interface | Indicates how the SSD is connected (interface). |
| Reads | Number of reads. |
| Write processes | Number of write processes. |
| block size | Specifies the block size of your hard drive. |
| Critical Warning | Number of critical warnings. |
| Available reserve storage | Indicates the available spare memory on your hard drive. |
| Wear in percent | Indicates the percentage of wear and tear on your hard disk. |
| Data blocks read | Indicates how many data blocks were read. |
| Data blocks written | Indicates how many data blocks were written. |
| Executed read commands | Indicates the read commands executed. |
| Executed write commands | Specifies the write commands executed on your hard disk. |
| Waiting time for commands in minutes | Specifies the waiting time for commands in minutes. |
| Number of improper shutdowns | Indicates the number of improper shutdowns of your hard drive. |
| integrity error | Number of hard drive integrity errors. The lower the raw value, the better. |
| Number of entries in the error memory | Number of entries in the error memory. Entries in the error memory. |
| For HDDs / Name | Description |
|---|---|
| temperature | Temperature of your drive in ° C. With normal use, temperatures between 40°C and 65°C are possible. The lower the raw value, the better. |
| Operating hours | Indicates in hours how long your HDD has been in operation (including standby). Indicates wear and tear, but says nothing about usage conditions during this time. The lower the raw value, the better. |
| Switch-on processes | The number of times your drive has been turned on and off. The lower the raw value, the better. |
| Transmission mode | Indicates how your HDD is connected (interface). |
| Interface | Indicates how your HDD is connected (interface). |
| Read error rate | Incorrectable errors while reading from your hard disk, will lead to reading again. Indicates a problem with the plate surface. The lower the raw value, the better. |
| Mean start-up time | Number of attempts to rev up your hard disk to the nominal speed. An increasing value indicates mechanical problems in the drive of the hard disk. The lower the raw value, the better. |
| Start / stop cycles | Number of start and stop processes for your drive (also in standby). Indicates wear and tear, as this is the hardest drive stress. The lower the raw value, the better. |
| Reallocated Sectors | Indicates the number of spare sectors that your hard disk has had to use up to now. With falling values, the probability of failure increases. |
| Positioning error of the read / write heads | Incorrectable errors while reading from your hard disk, will lead to reading again. Indicates a positioning problem in the read / write unit. The lower the raw value, the better. |
| Attempts to start the hard disk mechanics | Average of the start time in (milli-) seconds. Indicates problems with the motor or the plate bearings. The lower the raw value, the better. |
| New recalibration attempts | Number of attempts to recalibrate your hard drive. The lower the raw value, the better. |
| Abortions during the switch-off process | Number of aborts during the shutdown process of your hard disk. The lower the raw value, the better. |
| Number of parking processes of the read and write heads | The read / write unit is parked on the plastic ramp next to the plate. The read / write unit is parked when it is switched off or after idling for around 10 seconds. The lower the raw value, the better. |
| Number of used reserve sectors | Number of spare sectors consumed. Indicates surface problems, as only then does a reserve sector automatically replace a previously used one. The lower the raw value, the better. |
| Number of reserve sectors not yet assigned | Number of reserve sectors that have not yet been allocated. |
| Number of uncorrectable sectors | Number of uncorrectable sectors on your hard drive. If the values fall, the probability increases that your drive will suffer data loss and damage the read / write heads. |
| Transmission error | Number of transfer errors caused by your hard disk. The lower the raw value, the better. |
| Spelling mistake | Number of read errors that cannot be corrected by software. The lower the raw value, the better. |

S.M.A.R.T.